Interactive graphical analysis with VMD
connect to pRVS
establish a TurboVNC connection to the MPCDF remote visualization service as described here
Start VMD
~>module load vmd
~>vglrun vmd
Instructions for working with the GUI (assessment of UseCase1 is work in progress)
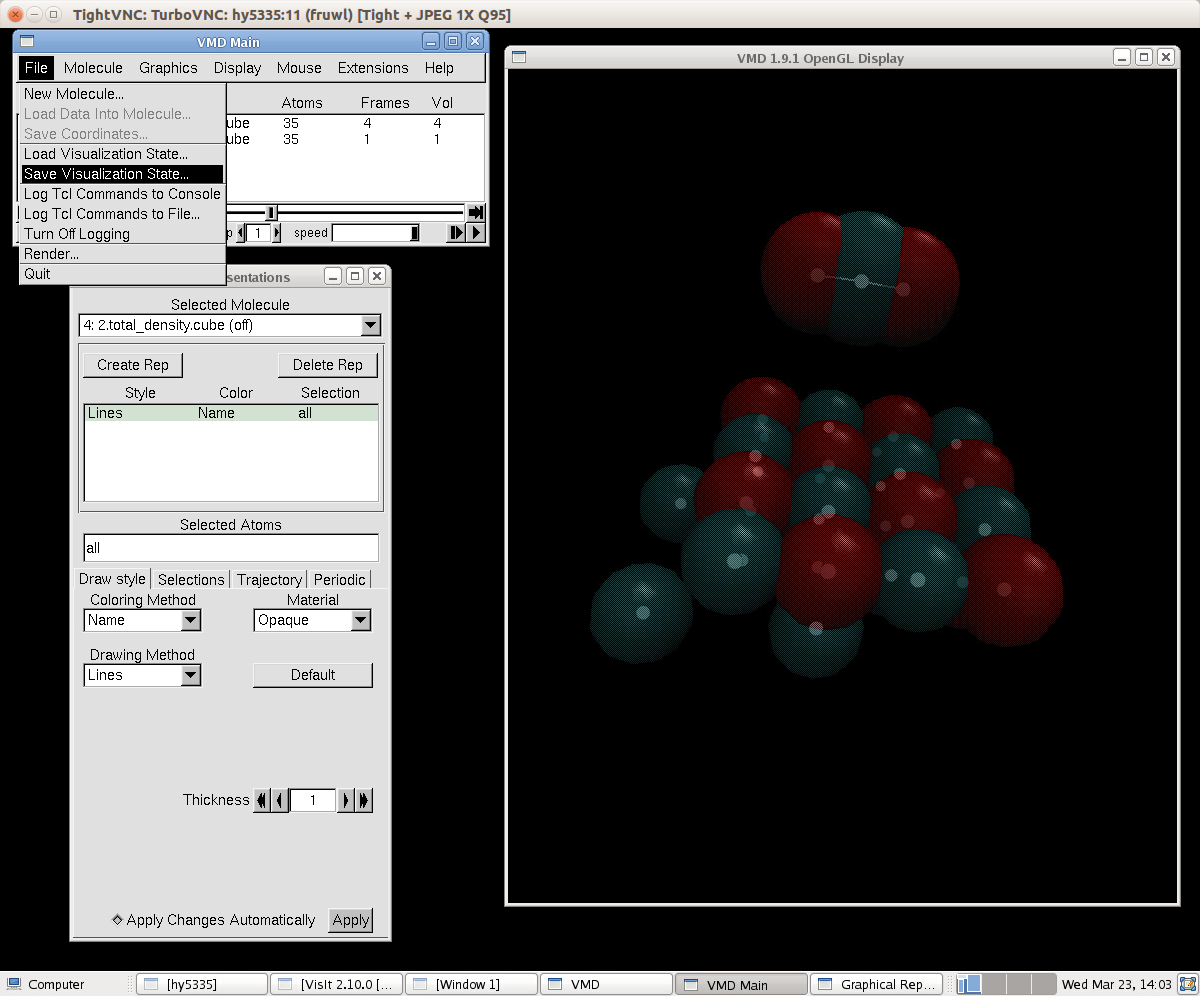
- predefine some default view and enable comprehensive analysis work flows for the user (Fig 1).
- save and load views.
- use different graphic representations - points, bonds, `VDW'
- atoms as spheres
- basic user interaction: a) start, pause, continue time evolution
- load different molecules and switch between them (screenshots 04 and 05).
- no default "player" functionality like in VisIt or ParaView
b) rotate, transfer, zoom in or out, change the number of shown unit cells
- all works
c) determine species type and atom number by clicking the sphere representing that atom
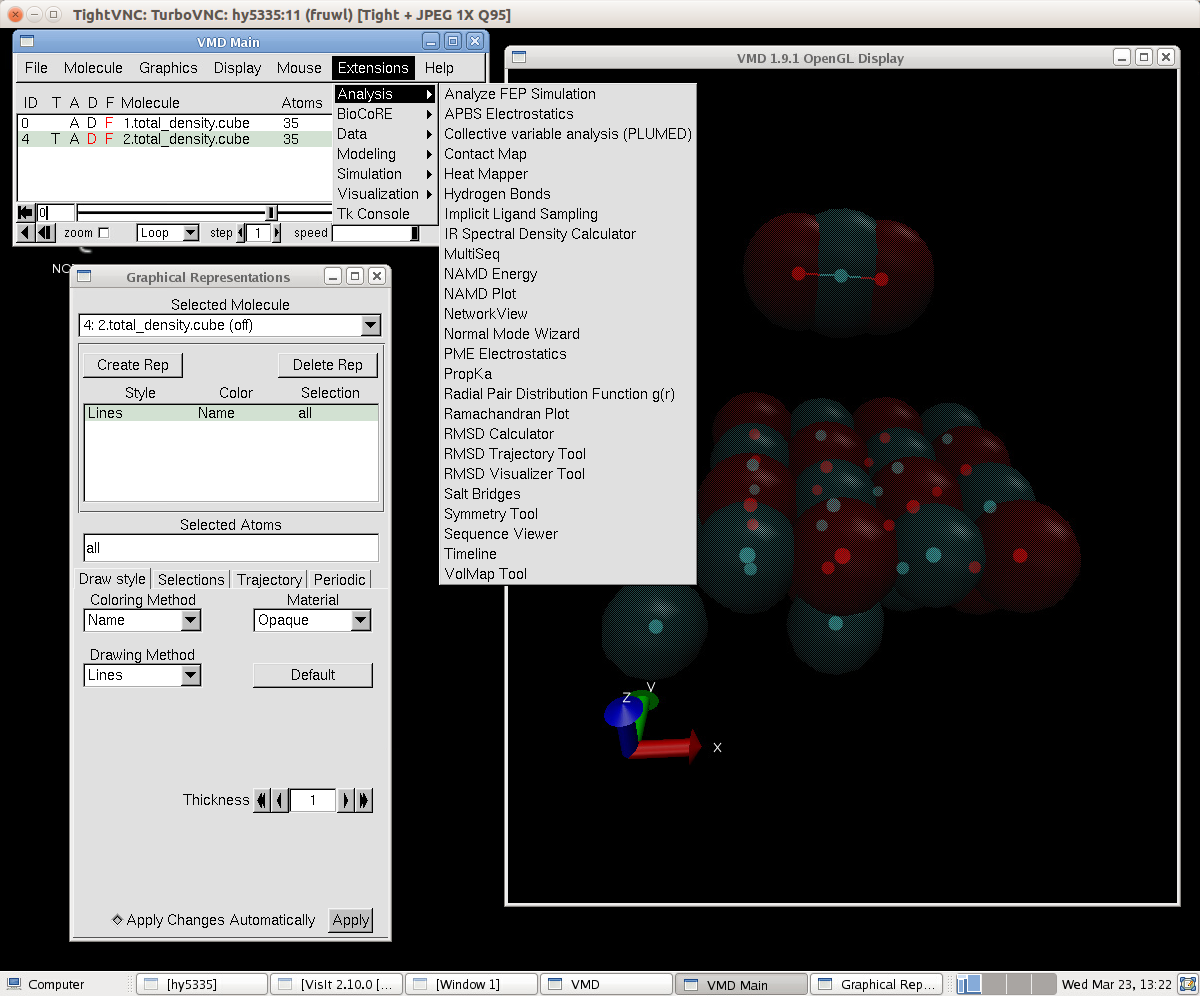
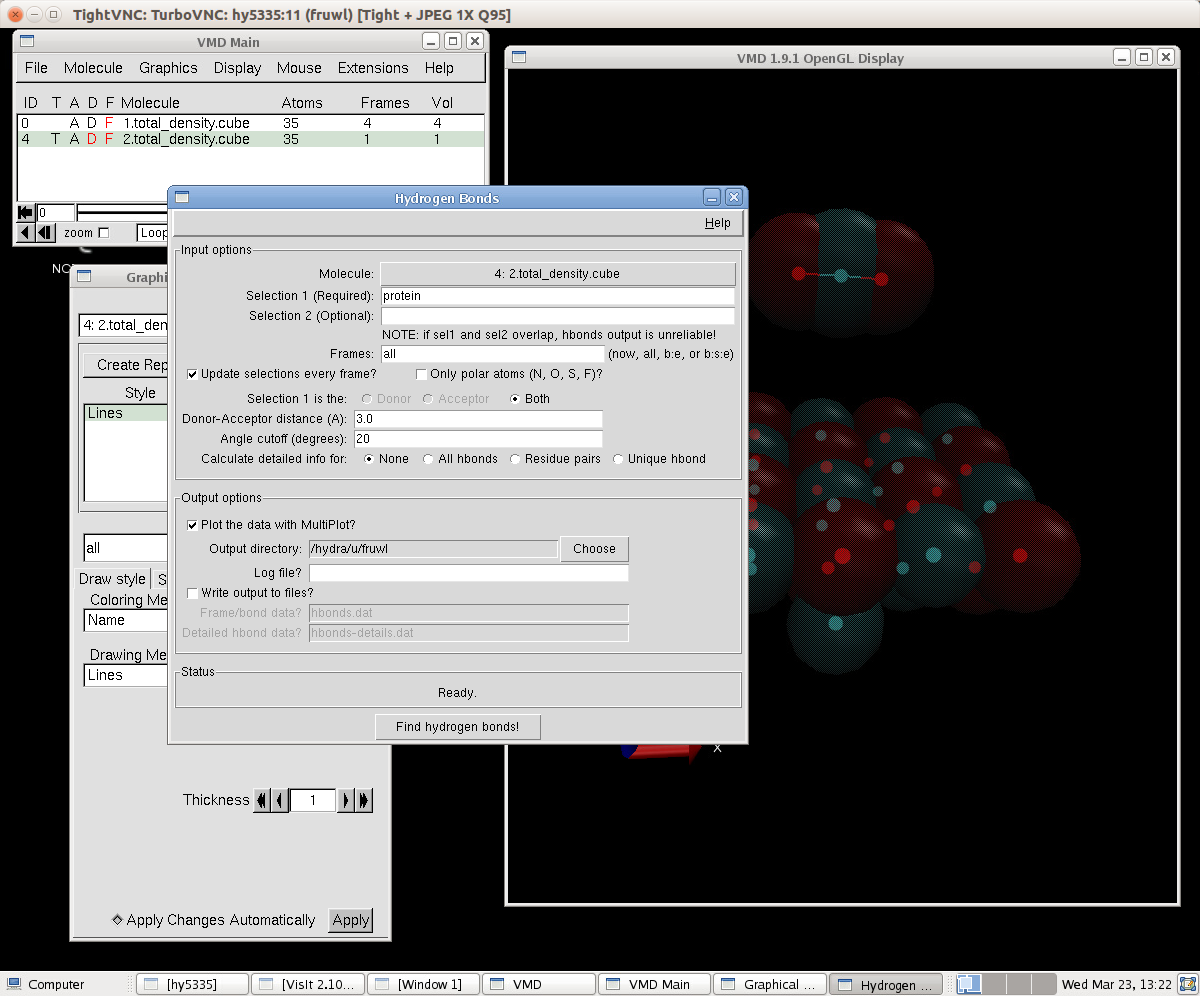
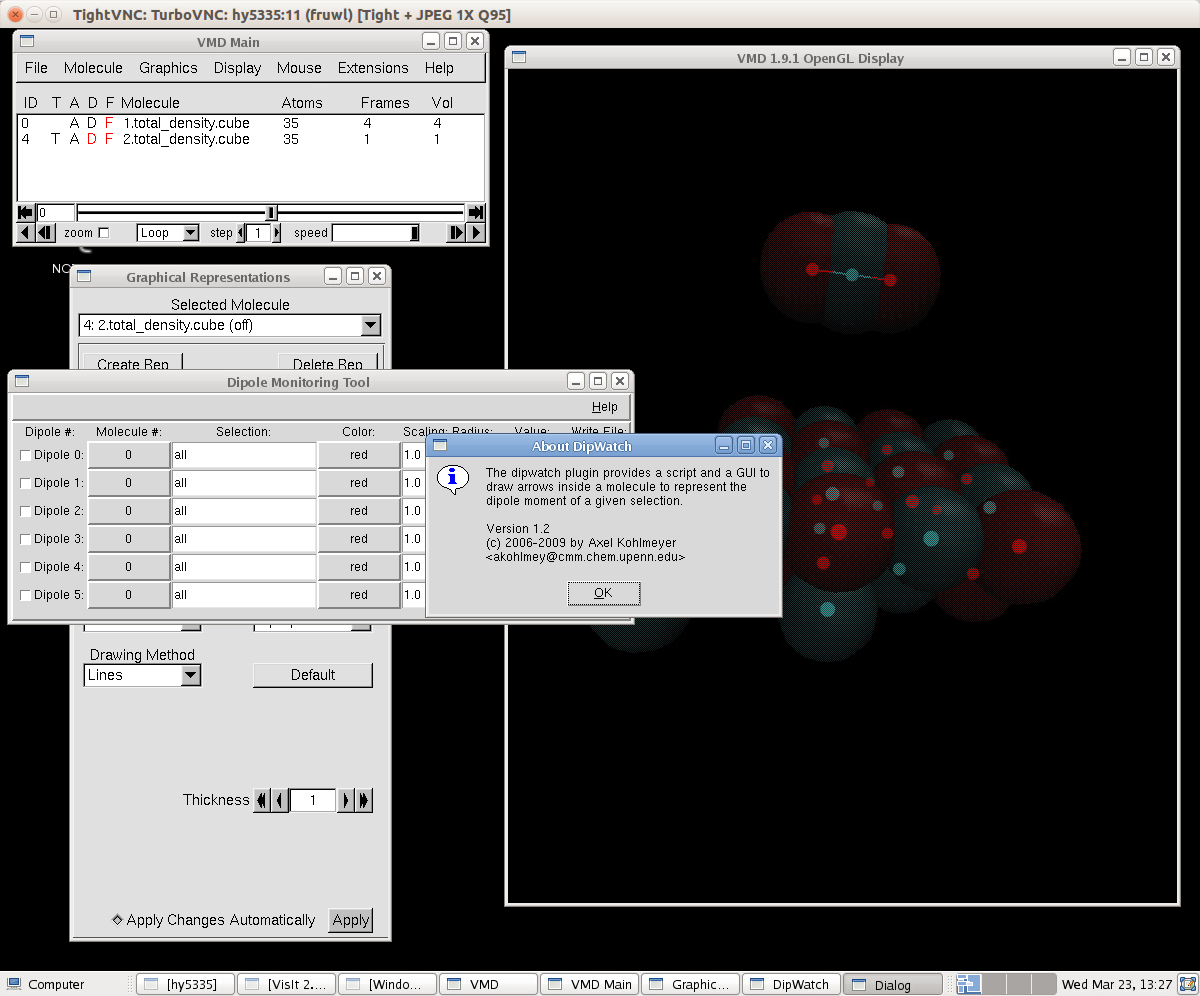
- types of analysis (Figs 2,3,4) but from the menu and not by simply clicking on the atom. The window is not interactive.
d) change the iso-value for the density, colour scale for the volumetric data
- not yet identified
- calculate the density integral within a 3D box selection
- not yet identified
- display distances, angles, and dihedral angles by selecting atoms
- not yet identified
- interactively replicate the unit cell
- not yet identified


